Graphical Charts
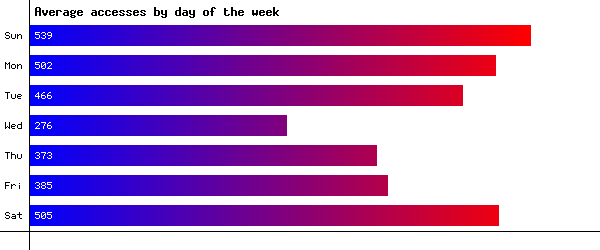
Days of the Week:

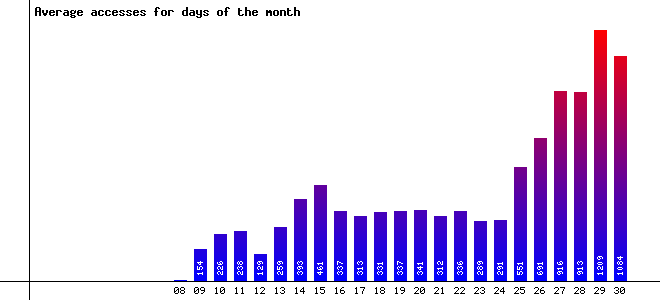
Days of the Month:

Hours of the Day:

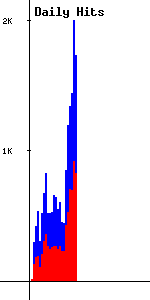
Daily Trends:
The blue lines represent the total hits for each day, including images
and all other files. The red lines represent just the hits on HTML pages.

Return to Main Server Statistics Page


